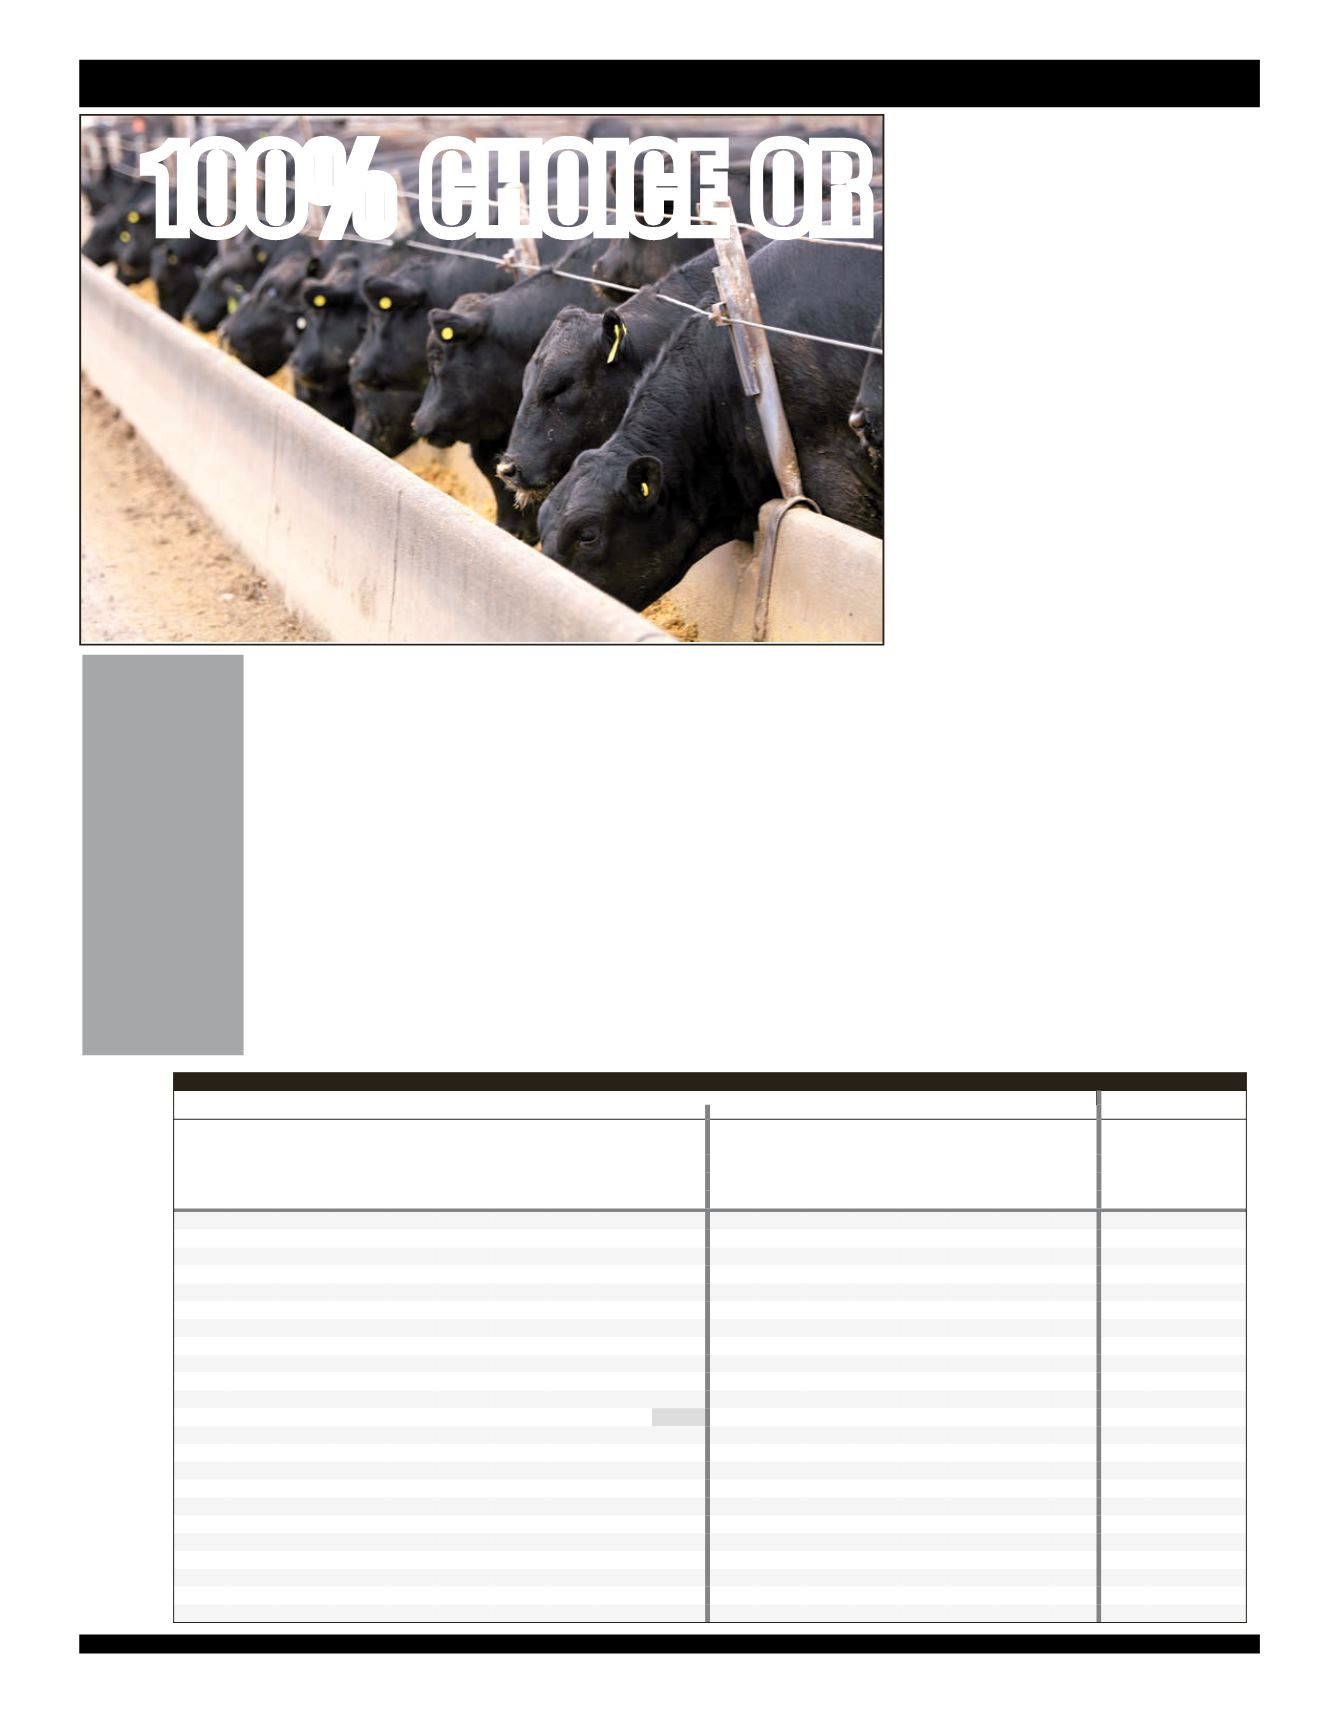
ADG 3.47lbs
DMC 5.84lbs
Prime 16.7%
Choice 83.3%
CAB 53%
100% Choice or Better
2015 CLOSEOUT DATA
FOR 50 HOME RAISED
BALANCER HEIFERS
100% CHOICE OR BETTER
Genomic results are a way to enhance
predictability of current selection tools, to
achieve more accuracy on EPDs for younger
animals, and to characterize genetics for traits
where it’s difficult to measure the animal’s own
performance for the trait, such as carcass traits
in breeding stock or maternal traits in bulls.
With the investment in genomic technology,
this means that in addition to the pedigree,
performance and progeny information that
are used in the calculation and reporting of
EPDs, genomic test results have also been
incorporated into the EPD.
Genomic-enhanced EPDs (GE-EPDs) are
important because they make use of the
results from the DNA test in addition to all
other sources of information to provide added
accuracy and reliability to the animal’s EPD.
In fact, depending on the trait, GE-EPDs on
unproven animals have the same amount of
accuracy as if they had already sired 8-20 calves.
GENOMIC TESTING AND EPDS
Spring 2017 International Cattle Evaluation
Statistical Breakdown
Balancer Active Sires
Expected Progeny Differences
Index
Growth and Maternal
Intake and Carcass
Values
CED BW WW YW MK TM CEM HP PG30 ST DMI
YG CW RE MB FT ADG RFI $Cow FPI
EPI
Num Animals
1261 1261 1261 1261 1261 1261 1261 1261 1261 1261 301 1261 1261 1261 1261 1261 301 301 664 1261 664
High
27
7.6 117 183
50
96
15
18
7
17 1.595 0.24
81 1.46 1.29 0.10 0.365 0.472 126.31 129.73 327.00
Average
12
0.0
69 104
26
61
7
4
1
4 0.062 -0.24
31 0.45 0.17 -0.02 0.043 -0.028 55.67 75.38 122.00
Low
-1 -10.7
-6
43
1
28
-11
-9
-5
-5 -1.344 -0.74 -15 -0.25 -1.04 -0.12 -0.221 -0.769 -5.52 39.70 -54.10
1%
22 -5.7 105 158
42
83
14
12
5
13 -0.892 -0.61
69 1.05 1.01 -0.09 0.310 -0.587 112.85 107.63 257.33
2%
21 -5.0
98 152
40
80
13
10
5
12 -0.794 -0.56
61 0.96 0.90 -0.08 0.229 -0.468 109.18 102.74 229.17
3%
21 -4.5
95 145
39
79
13
10
5
12 -0.655 -0.54
59 0.92 0.83 -0.07 0.220 -0.283 106.66 99.76 214.32
4%
20 -4.1
93 140
38
78
13
9
5
11 -0.430 -0.51
56 0.89 0.76 -0.07 0.212 -0.242 100.63 97.89 202.93
5%
20 -3.8
92 138
37
77
12
9
4
11 -0.368 -0.49
54 0.87 0.70 -0.07 0.202 -0.233 98.07 96.46 197.95
10%
18 -2.8
87 131
34
72
11
8
4
9 -0.216 -0.44
48 0.76 0.58 -0.06 0.159 -0.164 86.34 90.50 175.25
15%
17 -2.3
83 126
33
70
10
7
3
8 -0.114 -0.41
45 0.70 0.49 -0.05 0.136 -0.138 77.37 87.25 156.51
20%
16 -1.8
80 121
32
68
10
7
3
7 -0.067 -0.37
42 0.65 0.43 -0.05 0.113 -0.101 72.27 84.15 144.46
25%
15 -1.4
77 116
31
66
9
6
3
6 -0.051 -0.34
40 0.62 0.38 -0.04 0.086 -0.069 67.33 82.02 138.35
30%
14 -1.1
75 113
30
65
9
5
2
6 -0.031 -0.33
38 0.57 0.33 -0.04 0.069 -0.054 63.27 79.91 135.30
35%
13 -0.8
73 110
29
64
8
5
2
5 -0.016 -0.30
36 0.53 0.29 -0.03 0.062 -0.045 60.88 78.40 131.23
40%
13 -0.5
71 107
28
62
8
5
2
5 -0.009 -0.28
34 0.50 0.25 -0.03 0.055 -0.034 58.32 77.15 127.16
45%
12 -0.3
70 105
27
62
8
4
2
4 0.004 -0.26
32 0.47 0.20 -0.02 0.045 -0.027 55.70 75.40 123.09
50%
12
0.1
68 102
27
60
7
4
1
4 0.013 -0.23
31 0.44 0.16 -0.02 0.034 -0.017 53.32 73.56 119.02
55%
11
0.3
66 100
26
59
7
3
1
4 0.028 -0.21
29 0.41 0.12 -0.02 0.027 -0.009 50.93 72.30 115.97
60%
11
0.7
65
97
25
58
6
3
1
3 0.044 -0.19
28 0.39 0.08 -0.01 0.016 0.000 48.89 71.17 111.58
65%
11
1.0
64
95
24
57
6
3
1
3 0.053 -0.17
26 0.36 0.05 -0.01 0.008 0.012 46.66 69.98 107.83
70%
10
1.2
62
93
23
56
6
2
0
2 0.066 -0.14
24 0.33 -0.01 0.00 0.001 0.020 43.56 68.66 103.76
75%
9
1.5
61
90
22
55
5
2
0
2 0.095 -0.12
22 0.29 -0.04 0.00 -0.010 0.027 40.60 67.58 98.68
80%
9
1.8
58
87
21
54
5
1
0
1 0.158 -0.10
20 0.25 -0.09 0.01 -0.020 0.042 37.94 66.55 94.61
85%
8
2.2
56
83
20
52
4
1
-1
1 0.243 -0.07
18 0.20 -0.15 0.01 -0.035 0.058 33.98 64.97 87.49
90%
7
2.6
53
78
18
50
3
0
-1
0 0.450 -0.04
15 0.15 -0.23 0.02 -0.056 0.091 30.83 62.79 76.54
95%
6
3.2
48
73
15
46
1
-1
-2
-1 0.806 -0.01
11 0.08 -0.34 0.03 -0.082 0.151 24.61 59.25 63.13
Spring 2017 Balancer Active Sires
30
th
Annual Production Sale 3


