8
Angus Bull Sale, Ellsworth KS
April 3, 2017
Comparison of Feed Efficiency Terms
Method
More Desirable
Less Desirable
Difference
F:G – Adjusted Feed Conversion:
usually on dry matter basis (lbs feed/
lb of gain)
Lower values
Example: 4.5 lbs
Higher values
Example: 7.5 lbs
Example: 3 lbs of dry matter
RFI – Residual Feed Intake:
usually
on dry matter basis
Negative values
Example: -1.7
Positive values
Example: +1.5
Example: 3.2 lbs of feed
Adj. DMI – Adjusted Dry Matter
Intake:
should be on dry matter basis
Negative values
Example: -0.9
Positive values
Example: +0.8
Example: 1.7 lbs of feed
2016 Carcass Information
Many thanks to our customers who share their carcass information with us, we are always excited to see it.
If you have any carcass information you would like to share feel free to mail or e-mail it too us.
Broken M Spring Group
Quality Grade # Head % Grade
Prime
10
29%
Chioce/+
23
68%
Choice -
1
3%
Select
0
0
Standard
0
0
Total # Head 34
CAB+
33
97%
Green Garden Angus
Quality Grade # Head % Grade
Prime
9
35%
Chioce/+
11
42%
Choice -
5
19%
Select
1
3%
Standard
0
0
Total # Head 26
CAB+
20
77%
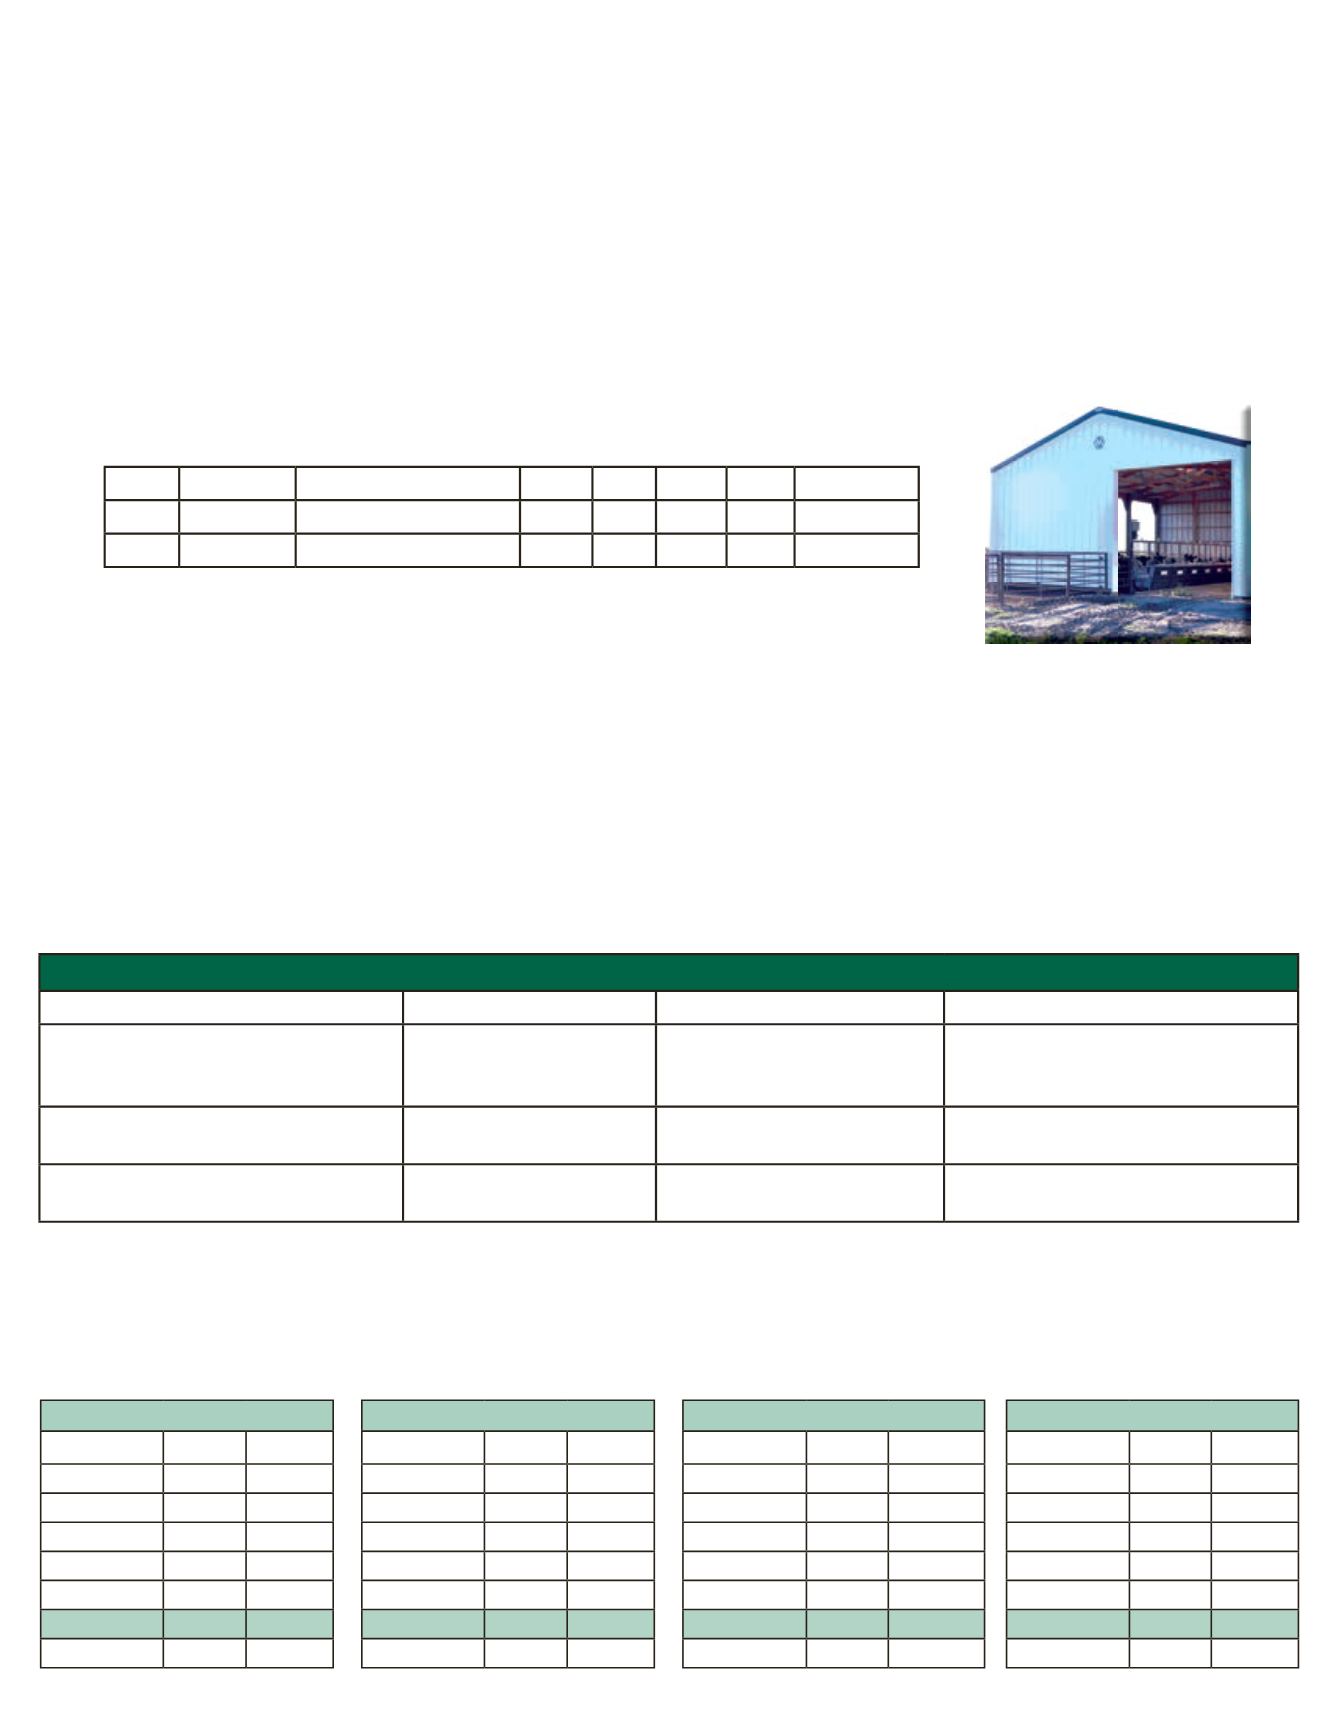
Green Garden
GrowSafe
Why a GrowSafe at Green Garden?
For forty plus years we have been identifying our most efficient cows by comparing cows weight in relation to the calves weaning
weights. In 2004 the American Angus Association introduced $Values, giving us another selection tool to help identify our efficient cows,
and also validate what we have done so far.
In 2010, we took a challenge from Dr. Craig Hayes to see how well our Calving Ease and High Marbling genetics would do in a feedlot
testing facility. The perception has been that high growth cattle are very efficient in a feedlot sitting, but when you add high marbling, calving
ease genetics to the mix, their feed efficiency goes down.
Then came the opportunity to get actual individual feed test data at the Hayes Beef Development Center in Iowa. The results were very
surprising. Our first sets of bulls to go through the test station showed what a huge difference in feed intake we had within our herd. In the
chart below we compare two of the bulls that had the exact same average daily gain of 4.73.
Plum Creek Ranch Spring Group
Quality Grade # Head % Grade
Prime
10
45%
Chioce/+
10
45%
Choice -
2
10%
Select
0
0
Standard
0
0
Total # Head 22
CAB+
20
90%
Broken M Fall Group
Quality Grade # Head % Grade
Prime
58
43%
Chioce/+
72
53%
Choice -
5
4%
Select
0
0
Standard
0
0
Total # Head 135
CAB+
130
96%
Tag Reg #
Sire
ADG DMI RFI
F:G IMF Ratio
Bull A 16962695 Gardens Star Time 4.73 14.2 -7.51 3.04 114
Bull B 16904773 ISU Imaging Q 3011 4.73 30.3 4.40 5.77
83
Bull A consumed 14.2 lbs of feed a day while Bull B consumed 30.3 lbs. For every pound of gain, Bull A consumed 3.04 lbs of feed, and
Bull B consumed 5.77 lbs of feed. The difference of the feed costs between those two animals is notable. This lead to two more years of
testing at the Hayes Center, before we decided to invest in our own GrowSafe system, allowing us to not only test our bulls, but also all of
our females. The last set of females on test did a remarkable job, as their pen ADG was 5.85 with an average DMI of 17.5 and an average
F:G of 3.09 with an average IMF score of 7.29, with an average back fat .28.
RFI is a measure of the amount of feed consumed above or below the average feed to gain of the contemporary group, which is 0.
Going back to our example, Bull A had an RFI of -7.51, well below the average of the contemporary group of 0, while Bull B had an RFi of
4.40 well above the pen average of 0.
With the use of actual cow weights/calf weaning weights, $EN, RADG EPD, DMI EPD and DNA, and feed test data we are advancing
towards our goal of creating problem free seedstock that will make you the most profit.


